Lower Freight Risk by Managing Total Ocean Shipping Cost, Not Just the Quoted Rate
Ocean freight is often treated as a purchasing line item: request several quotes, select the lowest rate, and book the shipment. In a fluctuating market, that approach can create more cost risk than savings.
A low sea freight rate can quickly lose its value if a shipment is delayed, rolled to a later vessel, packed inefficiently, charged unexpected surcharges, or shipped in a container with unused cubic capacity. For procurement managers and cargo owners, the better question is not simply, “What is today’s freight rate?” It is, “What is the total cost and risk of moving this cargo reliably?”
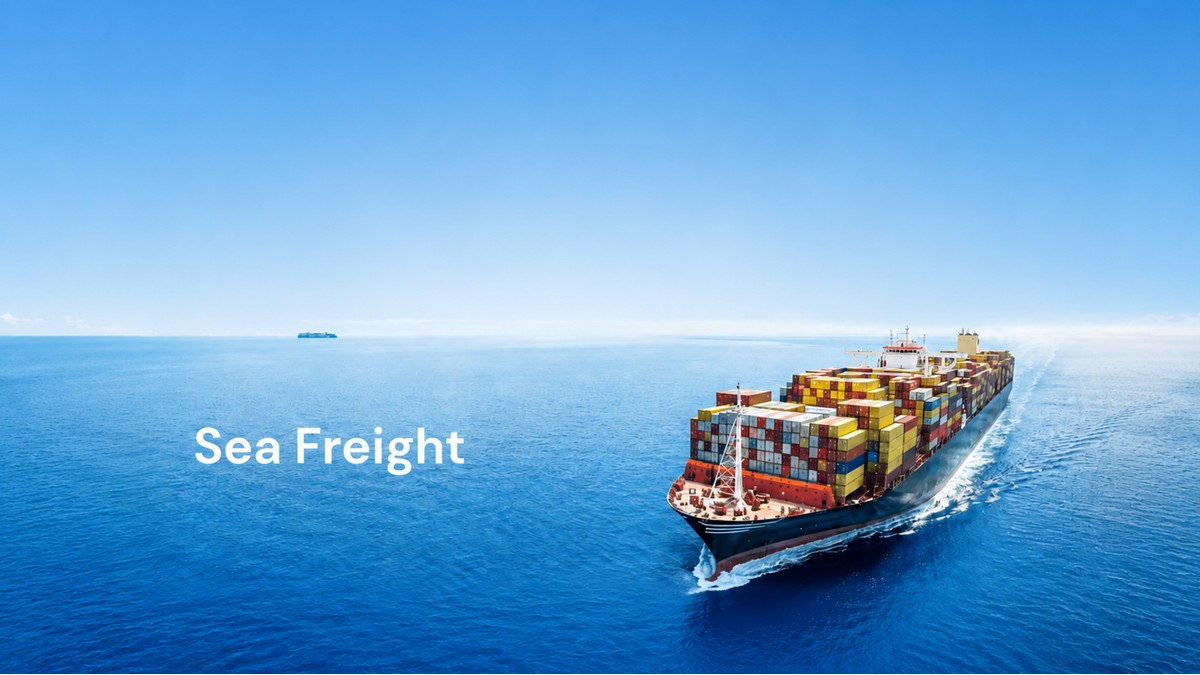
This matters because ocean transport carries more than 80% of global trade volume. According to UN Trade and Development (UNCTAD), disruptions around major maritime chokepoints have extended sailing routes, increased fuel use, and added pressure to vessel capacity. In mid-2024, Suez Canal transits had fallen sharply while arrivals around the Cape of Good Hope increased by 89%, illustrating how quickly route disruption can alter ocean freight economics.
This guide explains how businesses can make their sea freight services more cost-efficient through four practical levers:
- Understand the market factors behind rate volatility.
- Improve packaging and container utilization.
- Balance contract and spot-rate purchasing.
- Use third-party logistics data to manage total freight cost.
Why Ocean Freight Rates Change So Quickly
Ocean freight pricing is shaped by more than supply and demand. A quote can change because a carrier has limited space, because a route has become longer, because fuel costs have moved, or because ports are congested. Understanding these drivers helps buyers react with a plan instead of making rushed decisions.
1. Supply and Demand: Capacity Is Not Always Available When You Need It
Container shipping capacity is affected by the number of vessels available, blank sailings, equipment positioning, peak-season demand, and the time vessels spend at sea.
When demand rises before major retail seasons, holidays, or factory shutdowns, shippers may compete for the same vessel space. Carriers can then raise spot rates, apply peak-season surcharges, or reduce space commitments for lower-priority cargo. Conversely, when demand falls and capacity is abundant, spot rates can decline quickly.
However, available vessel capacity is only part of the picture. A longer voyage means that each vessel completes fewer round trips per year. If ships divert around the Cape of Good Hope instead of using the Suez Canal, the additional sailing time can effectively tighten capacity, even when the number of ships has not changed.
Procurement action: Review booking forecasts at least eight to twelve weeks before expected cargo-ready dates. Share a rolling forecast with carriers or freight forwarders, but update it regularly. Forecast accuracy improves allocation decisions and reduces last-minute premium bookings.
2. Fuel, Surcharges, and Carbon-Related Costs
Bunker fuel is a major operating cost for carriers. Changes in oil and marine fuel prices can influence bunker adjustment factors and other fuel-related surcharges. Longer routes also consume more fuel, which can increase both carrier costs and emissions-related expenses.
Importers should also expect shipping costs to be influenced by environmental regulation. The International Maritime Organization’s strategy aims for net-zero greenhouse-gas emissions from international shipping by or around 2050, with interim emissions-reduction checkpoints for 2030 and 2040. Regional regulations and carrier decarbonization measures may therefore affect freight pricing over time.
This does not mean every surcharge is unavoidable. It means buyers should request a clear cost breakdown and understand which charges are fixed, variable, carrier-controlled, or dependent on fuel, route, and equipment conditions.
Procurement action: Compare quotes on an all-in basis. Separate the base ocean rate from origin charges, destination charges, documentation fees, bunker-related charges, peak-season surcharges, equipment imbalance charges, customs costs, and inland transport.
3. Geopolitics, Chokepoints, Weather, and Port Congestion
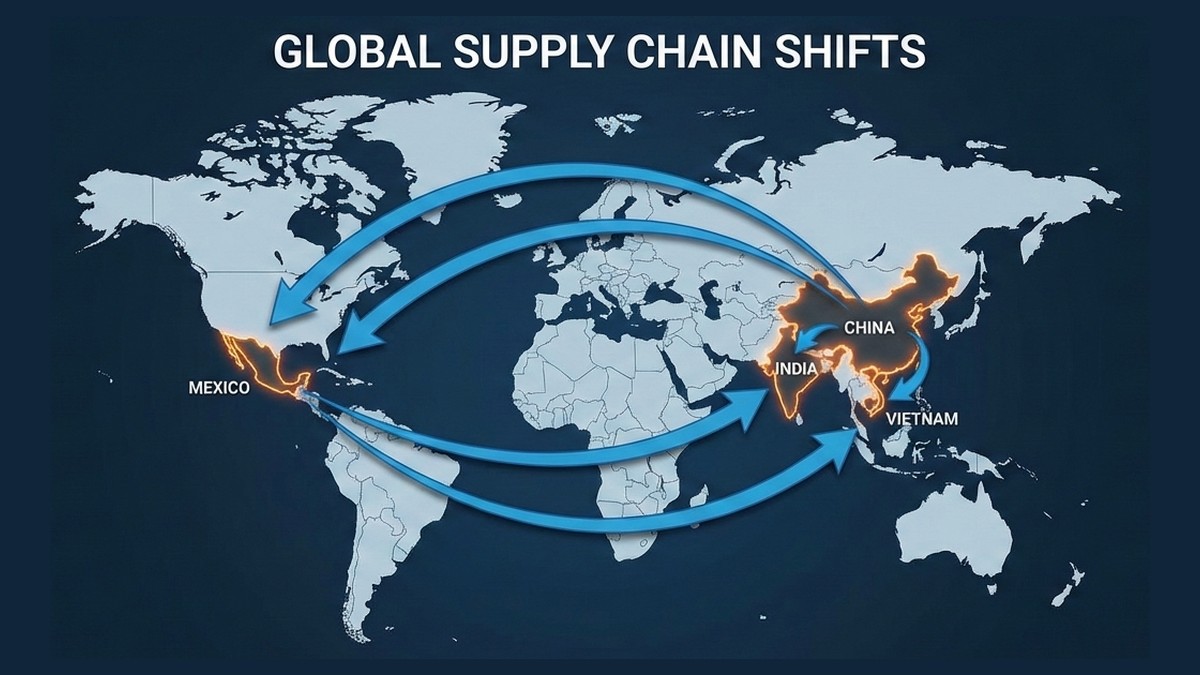
The Red Sea, Suez Canal, Panama Canal, and major transshipment hubs can affect global shipping far beyond their local regions. Conflict, security concerns, drought, severe weather, labor disruption, or port congestion can cause vessel diversions, skipped ports, schedule delays, and congestion surcharges.
UNCTAD reported that rerouting and disruptions in 2024 increased global vessel ton-mile demand by 3% and container ship demand by 12%. For cargo owners, the impact may appear as longer transit times, higher insurance exposure, reduced schedule reliability, or higher inventory carrying costs.
The following table summarizes the main market drivers and the decisions they should trigger.
| Market factor |
How it affects freight cost |
What procurement teams should do |
| Strong seasonal demand |
Space tightens and spot rates increase |
Book earlier and protect core volume with contracts |
| Blank sailings or vessel delays |
Fewer available departures and rolled cargo |
Use weekly schedule monitoring and backup routings |
| Fuel price movement |
Bunker-related charges may change |
Review surcharge formulas and quote validity |
| Route diversions |
More sailing days, fuel, and capacity pressure |
Update inventory buffers and evaluate alternate ports |
| Port congestion |
Storage, demurrage, detention, and delay risk |
Confirm free-time terms and destination readiness |
| Equipment imbalance |
Container shortages or repositioning charges |
Forecast container needs by port and equipment type |
Start with the Shipment: Improve CBM and Container Utilization
Before negotiating a lower freight rate, examine how efficiently cargo uses container space. This is one of the most controllable cost levers for shippers using international sea cargo services.
CBM means cubic meter. It is calculated by multiplying cargo length, width, and height. For LCL cargo, freight is commonly charged by volume or weight, depending on which is higher under the carrier’s charging rules. For FCL cargo, unused container space does not lower the container rate, but it increases freight cost per unit shipped.
Measure the Right Container Utilization Metrics
A container is not fully utilized just because it is full by weight or by appearance. Some cargo “cubes out” before reaching the payload limit. Other cargo reaches the weight limit with unused space. Each product category needs its own loading strategy.
Track the following metrics:
- CBM utilization: Loaded cargo CBM divided by usable container CBM.
- Weight utilization: Cargo gross weight divided by permitted payload.
- Freight cost per unit: Total freight-related cost divided by units, cartons, pallets, or kilograms shipped.
- Freight cost per CBM: Useful for LCL shipments and comparing packaging options.
- Damage rate: Lower-cost packaging is not a saving if it causes claims or rejected cargo.
- Container mix: The number of 20-foot, 40-foot, 40-foot high-cube, reefer, or special containers used.
For example, a 40-foot high-cube container generally provides more cubic capacity than a standard 40-foot container. If light, bulky products routinely leave unused space in standard containers, a high-cube option may lower the freight cost per unit. The decision should still consider equipment availability, route pricing, cargo stability, and destination handling.
Practical Packaging Changes That Can Reduce Ocean Freight Cost
Packaging changes must protect product quality, meet customer requirements, and comply with shipping regulations. The objective is not simply to make cartons smaller. It is to improve the ratio of saleable product to shipping volume without increasing damage or handling risk.
Consider these practical actions:
-
Audit carton dimensions against product dimensions. Identify excess empty space, unnecessary inserts, and carton designs that create unusable gaps during loading.
-
Standardize carton footprints where possible. Cartons that align with pallet dimensions and container width are easier to stack and can reduce void space.
-
Review pallet strategy. Pallets simplify handling but may reduce CBM efficiency. For suitable cargo, floor-loaded containers can increase capacity. For high-value, fragile, or warehouse-dependent cargo, palletization may still be the better total-cost choice.
-
Use load plans before cargo reaches the warehouse. A digital load plan can show carton orientation, stack height, weight distribution, and estimated remaining capacity before the container is loaded.
-
Consolidate compatible purchase orders. Small, frequent shipments can create unnecessary LCL charges and handling costs. Where inventory and lead times allow, combining supplier orders may create a more efficient FCL shipment.
-
Test changes with a total-cost model. Include packaging material, labor, damage claims, warehouse handling, storage, and freight savings. A packaging change is only successful when the total landed cost improves.
Do Not Chase 100% CBM at the Expense of Safety
Maximizing CBM should never lead to unsafe loading, overweight containers, poor weight distribution, or cargo damage. Heavy cargo must be placed carefully, properly secured, and loaded within container and road weight limits. Shippers should also ensure that verified gross mass requirements and local transport restrictions are met.
The best loading plan is not always the one with the highest CBM percentage. It is the plan that protects cargo, meets compliance requirements, avoids rework, and lowers total transport cost.
Contract Rates vs. Spot Rates: Build a Portfolio, Not a Guess
The contract-versus-spot decision is often framed as a choice between certainty and flexibility. In practice, most shippers need both.
A contract rate is typically agreed for a defined period, trade lane, volume commitment, equipment type, and service scope. A spot rate is a price available for a specific shipment or short period, based on current market conditions. Neither is always cheaper.
| Rate approach |
Best suited for |
Main advantage |
Main risk |
| Long-term or seasonal contract |
Predictable, recurring volume |
Better budget visibility and potential space protection |
May be above the spot market if rates fall |
| Spot rate |
Irregular or opportunistic volume |
Flexibility when the market is soft |
Rate and space can change quickly |
| Blended portfolio |
Most medium and large shippers |
Balances cost control with flexibility |
Requires active review and clear governance |
A Practical Starting Allocation Strategy
There is no universal “correct” percentage. The right mix depends on volume predictability, customer delivery commitments, product margins, inventory buffers, and route risk.
As a starting point:
- Shippers with highly predictable, business-critical volumes may protect 60% to 80% of expected volume through contracts or committed allocations.
- Shippers with moderate forecast confidence may contract 40% to 60% and leave the remainder flexible.
- Shippers with highly seasonal, project-based, or uncertain volumes may use a lower contract share, while accepting greater spot-market exposure.
These are planning ranges, not market guarantees. A contract should be assessed on more than its headline rate. Ask whether it includes realistic minimum quantity commitments, equipment access, rollover terms, surcharge treatment, transit-time expectations, free time, and service recovery procedures.
Review the Mix Monthly, Not Only at Tender Time
A once-a-year tender may establish commercial terms, but it cannot replace active market management. Review the contract and spot portfolio monthly or quarterly.
Key questions include:
- Is actual volume tracking near the contracted commitment?
- Are booked shipments moving on the intended vessel?
- Are spot rates materially above or below contracted levels?
- Have route diversions changed transit-time and inventory requirements?
- Are origin and destination accessorial charges increasing?
- Does the carrier’s schedule reliability meet the needs of the business?
A lower contract rate has limited value if cargo is repeatedly rolled, delayed, or diverted to a less suitable port. Service performance should remain part of the rate decision.
Use 3PL Data to Manage the Full Cost Structure
Freight invoices often arrive after operational decisions have already been made. By then, it is difficult to correct avoidable charges. A capable third-party logistics provider can help turn freight data into an operating tool rather than a historical report.
The purpose of logistics data monitoring is not to create more dashboards. It is to identify cost leakage early, quantify root causes, and assign corrective actions.
Build a Cost Dashboard That Answers Management Questions
A useful dashboard should connect freight costs to shipments, purchase orders, containers, lanes, suppliers, and delivery performance. It should show actual costs alongside budget or quoted costs.
Monitor at least these categories:
| Data point |
Why it matters |
| Ocean freight and surcharges by lane |
Shows where rate exposure is changing |
| Cost per container, CBM, kilogram, and unit |
Reveals packaging and consolidation opportunities |
| Contract versus spot spend |
Shows whether the purchasing strategy is being followed |
| Booking-to-departure lead time |
Identifies late-booking risk |
| Transit time and schedule reliability |
Connects freight choices to inventory planning |
| Demurrage and detention |
Identifies destination, documentation, or free-time issues |
| Origin and destination local charges |
Exposes costs outside the headline ocean rate |
| Accessorial charges and invoice variances |
Helps prevent recurring billing leakage |
| Carbon-emissions data, where available |
Supports customer reporting and future compliance planning |
Turn Data Into a Monthly Cost-Control Routine
A practical review process can be simple:
-
Validate invoices against approved quotes and bookings. Flag differences in currency, exchange rate, surcharge, equipment, free time, and local charges.
-
Review the top five cost variances. Focus on the lanes, suppliers, or charges with the largest financial impact instead of trying to solve every minor issue at once.
-
Identify the operational cause. Was the cost caused by late cargo readiness, poor forecast accuracy, insufficient CBM, documentation delay, port congestion, or an incorrect quote?
-
Assign an owner and a corrective action. Procurement may own rate governance, suppliers may own packing readiness, and logistics teams may own booking lead times.
-
Measure whether the action worked. A cost-control program should show changes over time, not only describe past issues.
Choosing a Logistics Partner for Cost Control
A logistics partner should be assessed on visibility, operational capability, and pricing clarity, not only on the first quoted rate. This is especially important when a business uses multiple origins, destinations, cargo types, or shipping terms.
For example, HLS Honour Lane’s sea freight services cover FCL, LCL, sea-air, project cargo, customs brokerage, break-bulk, and RO/RO options. The company states that it operates as an NVOCC with carrier contracts supporting shipments across five continents.
For businesses seeking stronger cost visibility, HLS also describes a consolidated technology platform that supports shipment tracking, schedule and rate enquiries, and supply-chain data exchange. Its platform reports more than 150,000 shipments booked and tracked annually. These capabilities can help procurement and logistics teams monitor costs by shipment and act before exceptions become recurring expenses.
The right provider should be able to explain the cost structure clearly, challenge inefficient shipment plans, offer alternative routings when appropriate, and provide usable data for internal decisions.
FAQ: Ocean Freight Cost Optimization
What is the fastest way to reduce ocean freight costs?
Start by measuring total freight cost per unit and per CBM, then identify underfilled containers, avoidable LCL shipments, late bookings, and unplanned local charges. These are often more controllable than the market ocean rate.
Should a business always choose contract rates over spot rates?
No. Contract rates are useful for predictable core volume and budget stability, while spot rates provide flexibility. Most shippers benefit from a planned mix based on volume certainty, margin sensitivity, and service requirements.
How much CBM utilization is considered good?
There is no single target for every cargo type. The goal is to maximize usable capacity while maintaining safe loading, legal weight compliance, cargo protection, and efficient unloading. Track performance by product category and container type rather than using one company-wide target.
Can a 3PL help control charges beyond the ocean freight rate?
Yes. A 3PL can help monitor local charges, detention, demurrage, documentation fees, inland costs, invoice variances, booking lead times, and transit-time performance. These costs can materially affect total landed cost.
How often should ocean freight strategy be reviewed?
Review operational performance monthly and the contract-versus-spot mix at least quarterly. During disruptions, peak season, or major rate movements, review critical lanes more frequently.
Take the Next Step
Rate volatility is part of global shipping. The businesses that control costs most effectively do not rely on one annual tender or one low quote. They combine market awareness, efficient packaging, disciplined capacity purchasing, and shipment-level data.
For tailored sea freight services and support with international routing, FCL or LCL planning, cargo consolidation, and shipment visibility, contact HLS Honour Lane for customized sea freight service solutions.